1. vis.js 다운로드
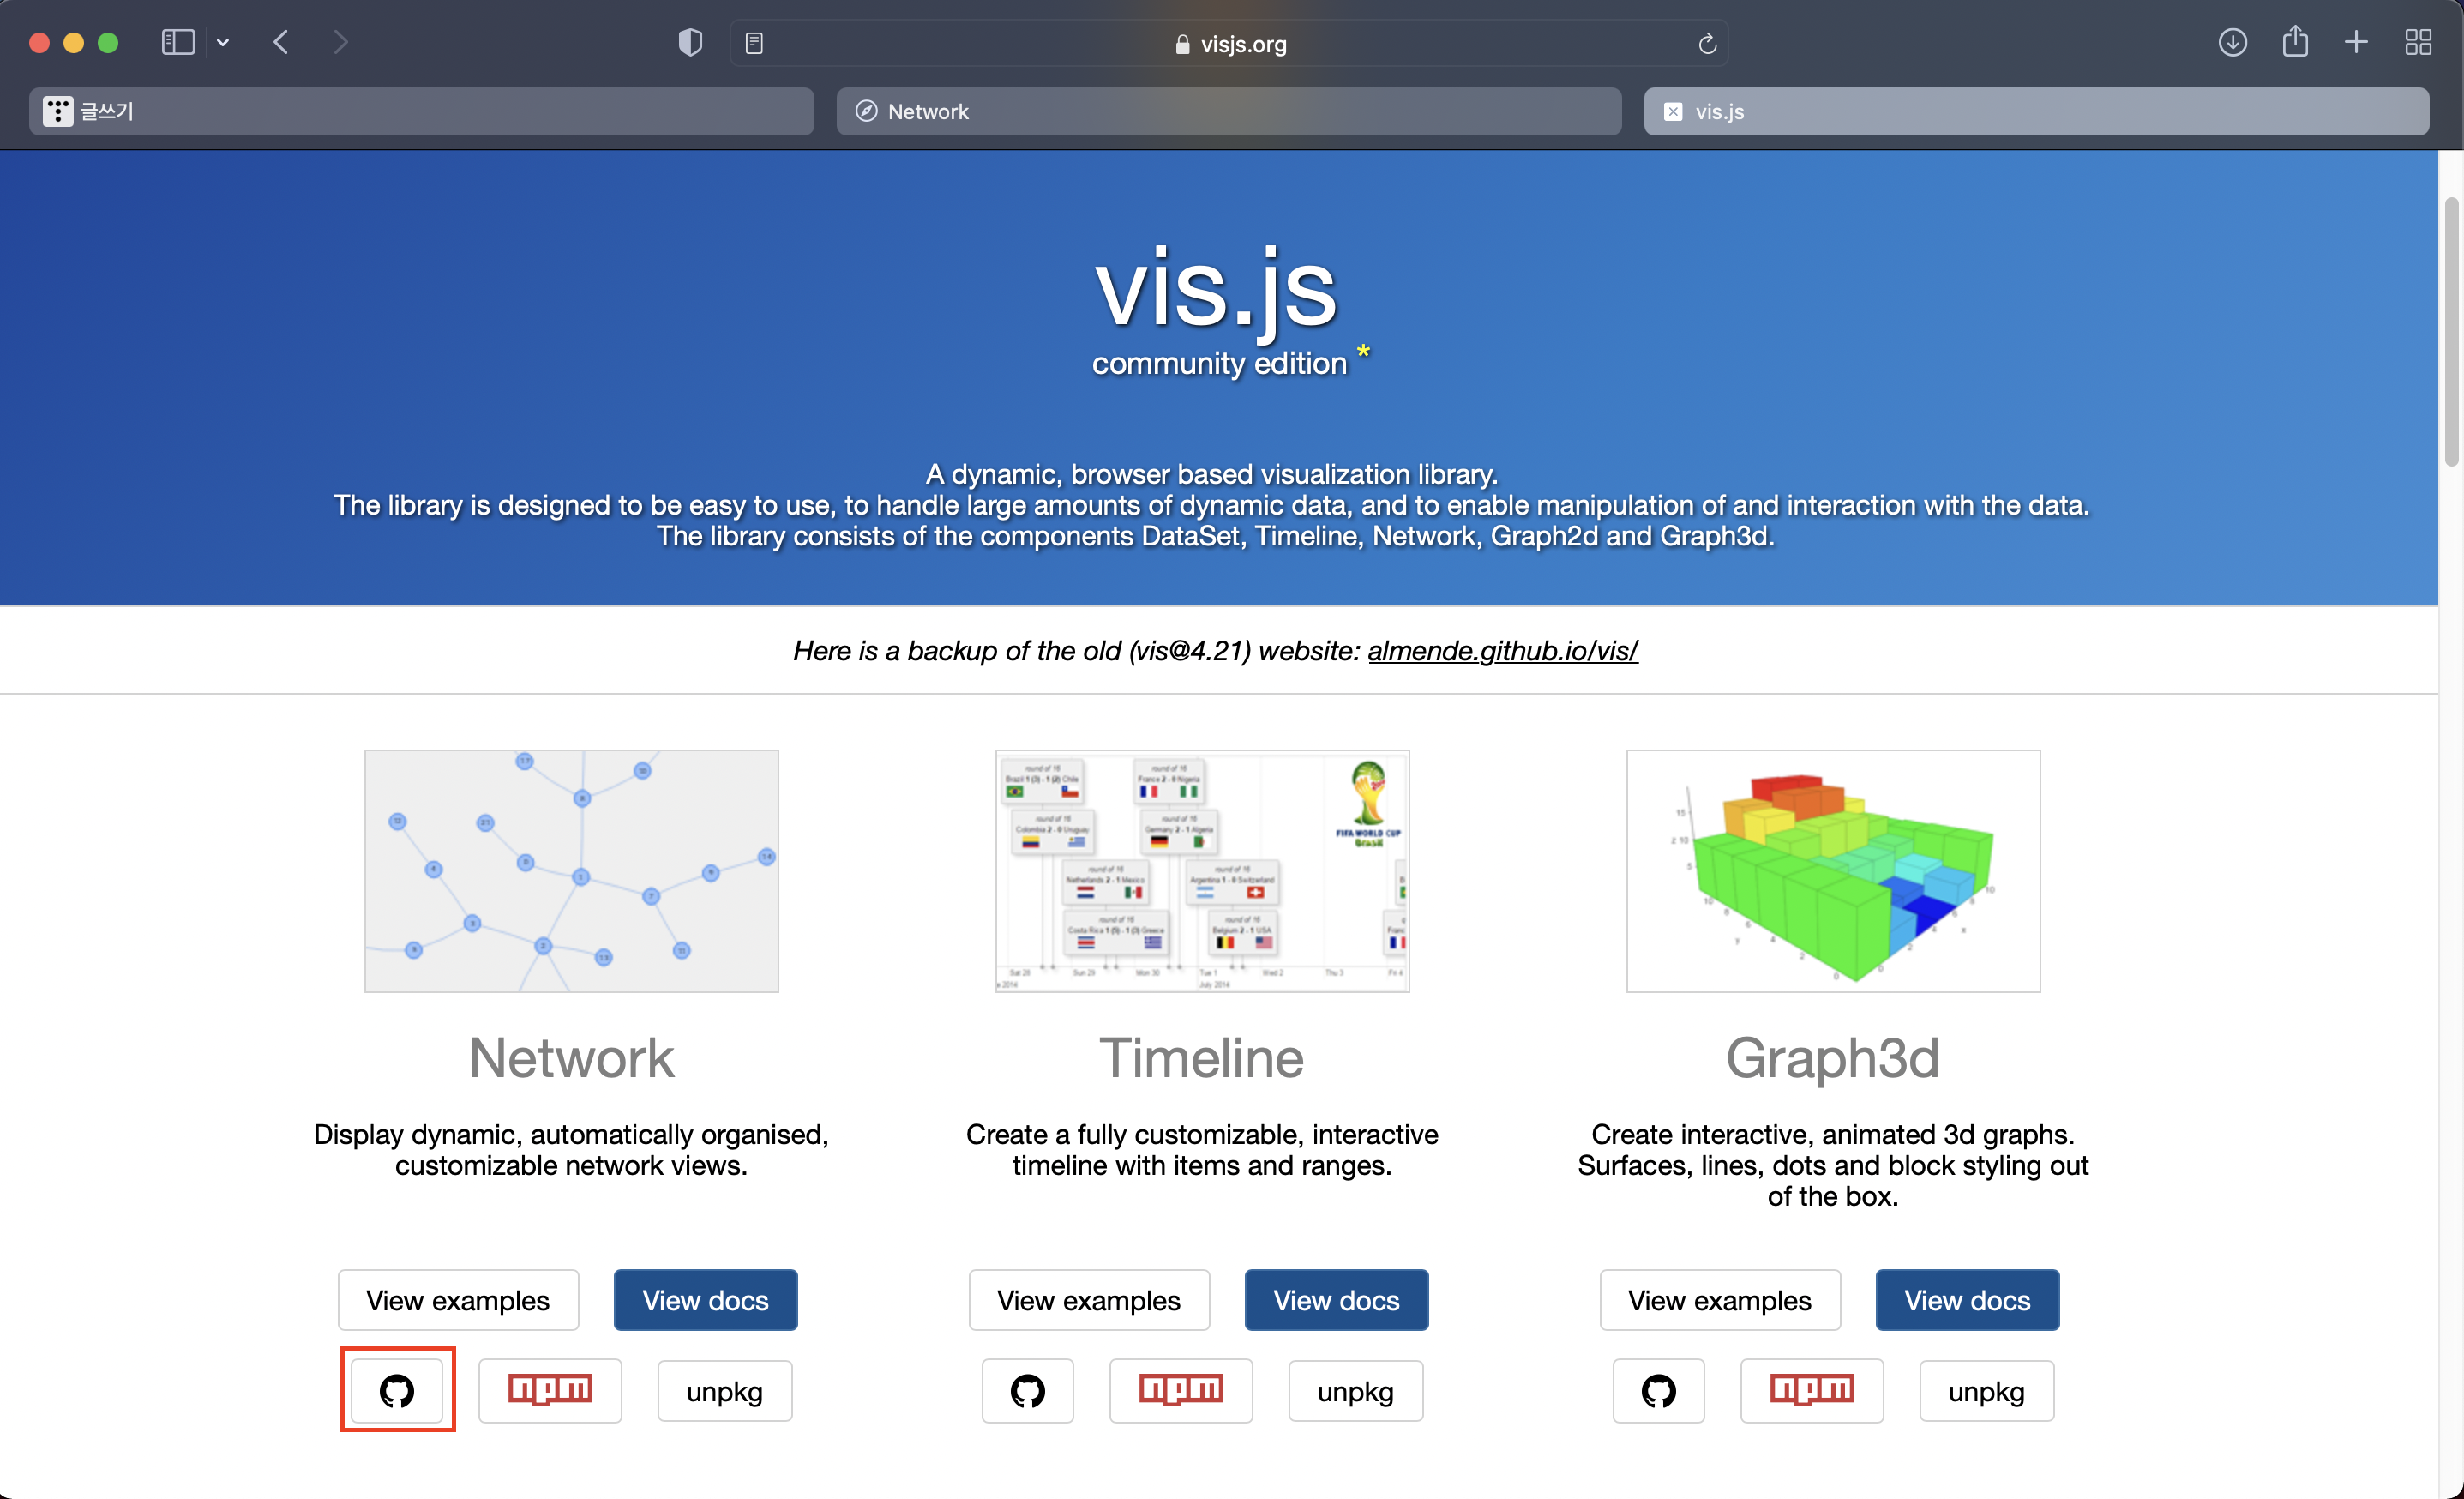
1. 아래의 vis.js 페이지에 접속합니다.
vis.js
vis.js community edition A dynamic, browser based visualization library. The library is designed to be easy to use, to handle large amounts of dynamic data, and to enable manipulation of and interaction with the data. The library consists of the components
visjs.org
2. 연결되어있는 깃허브 링크로 들어가 파일을 다운로드합니다.
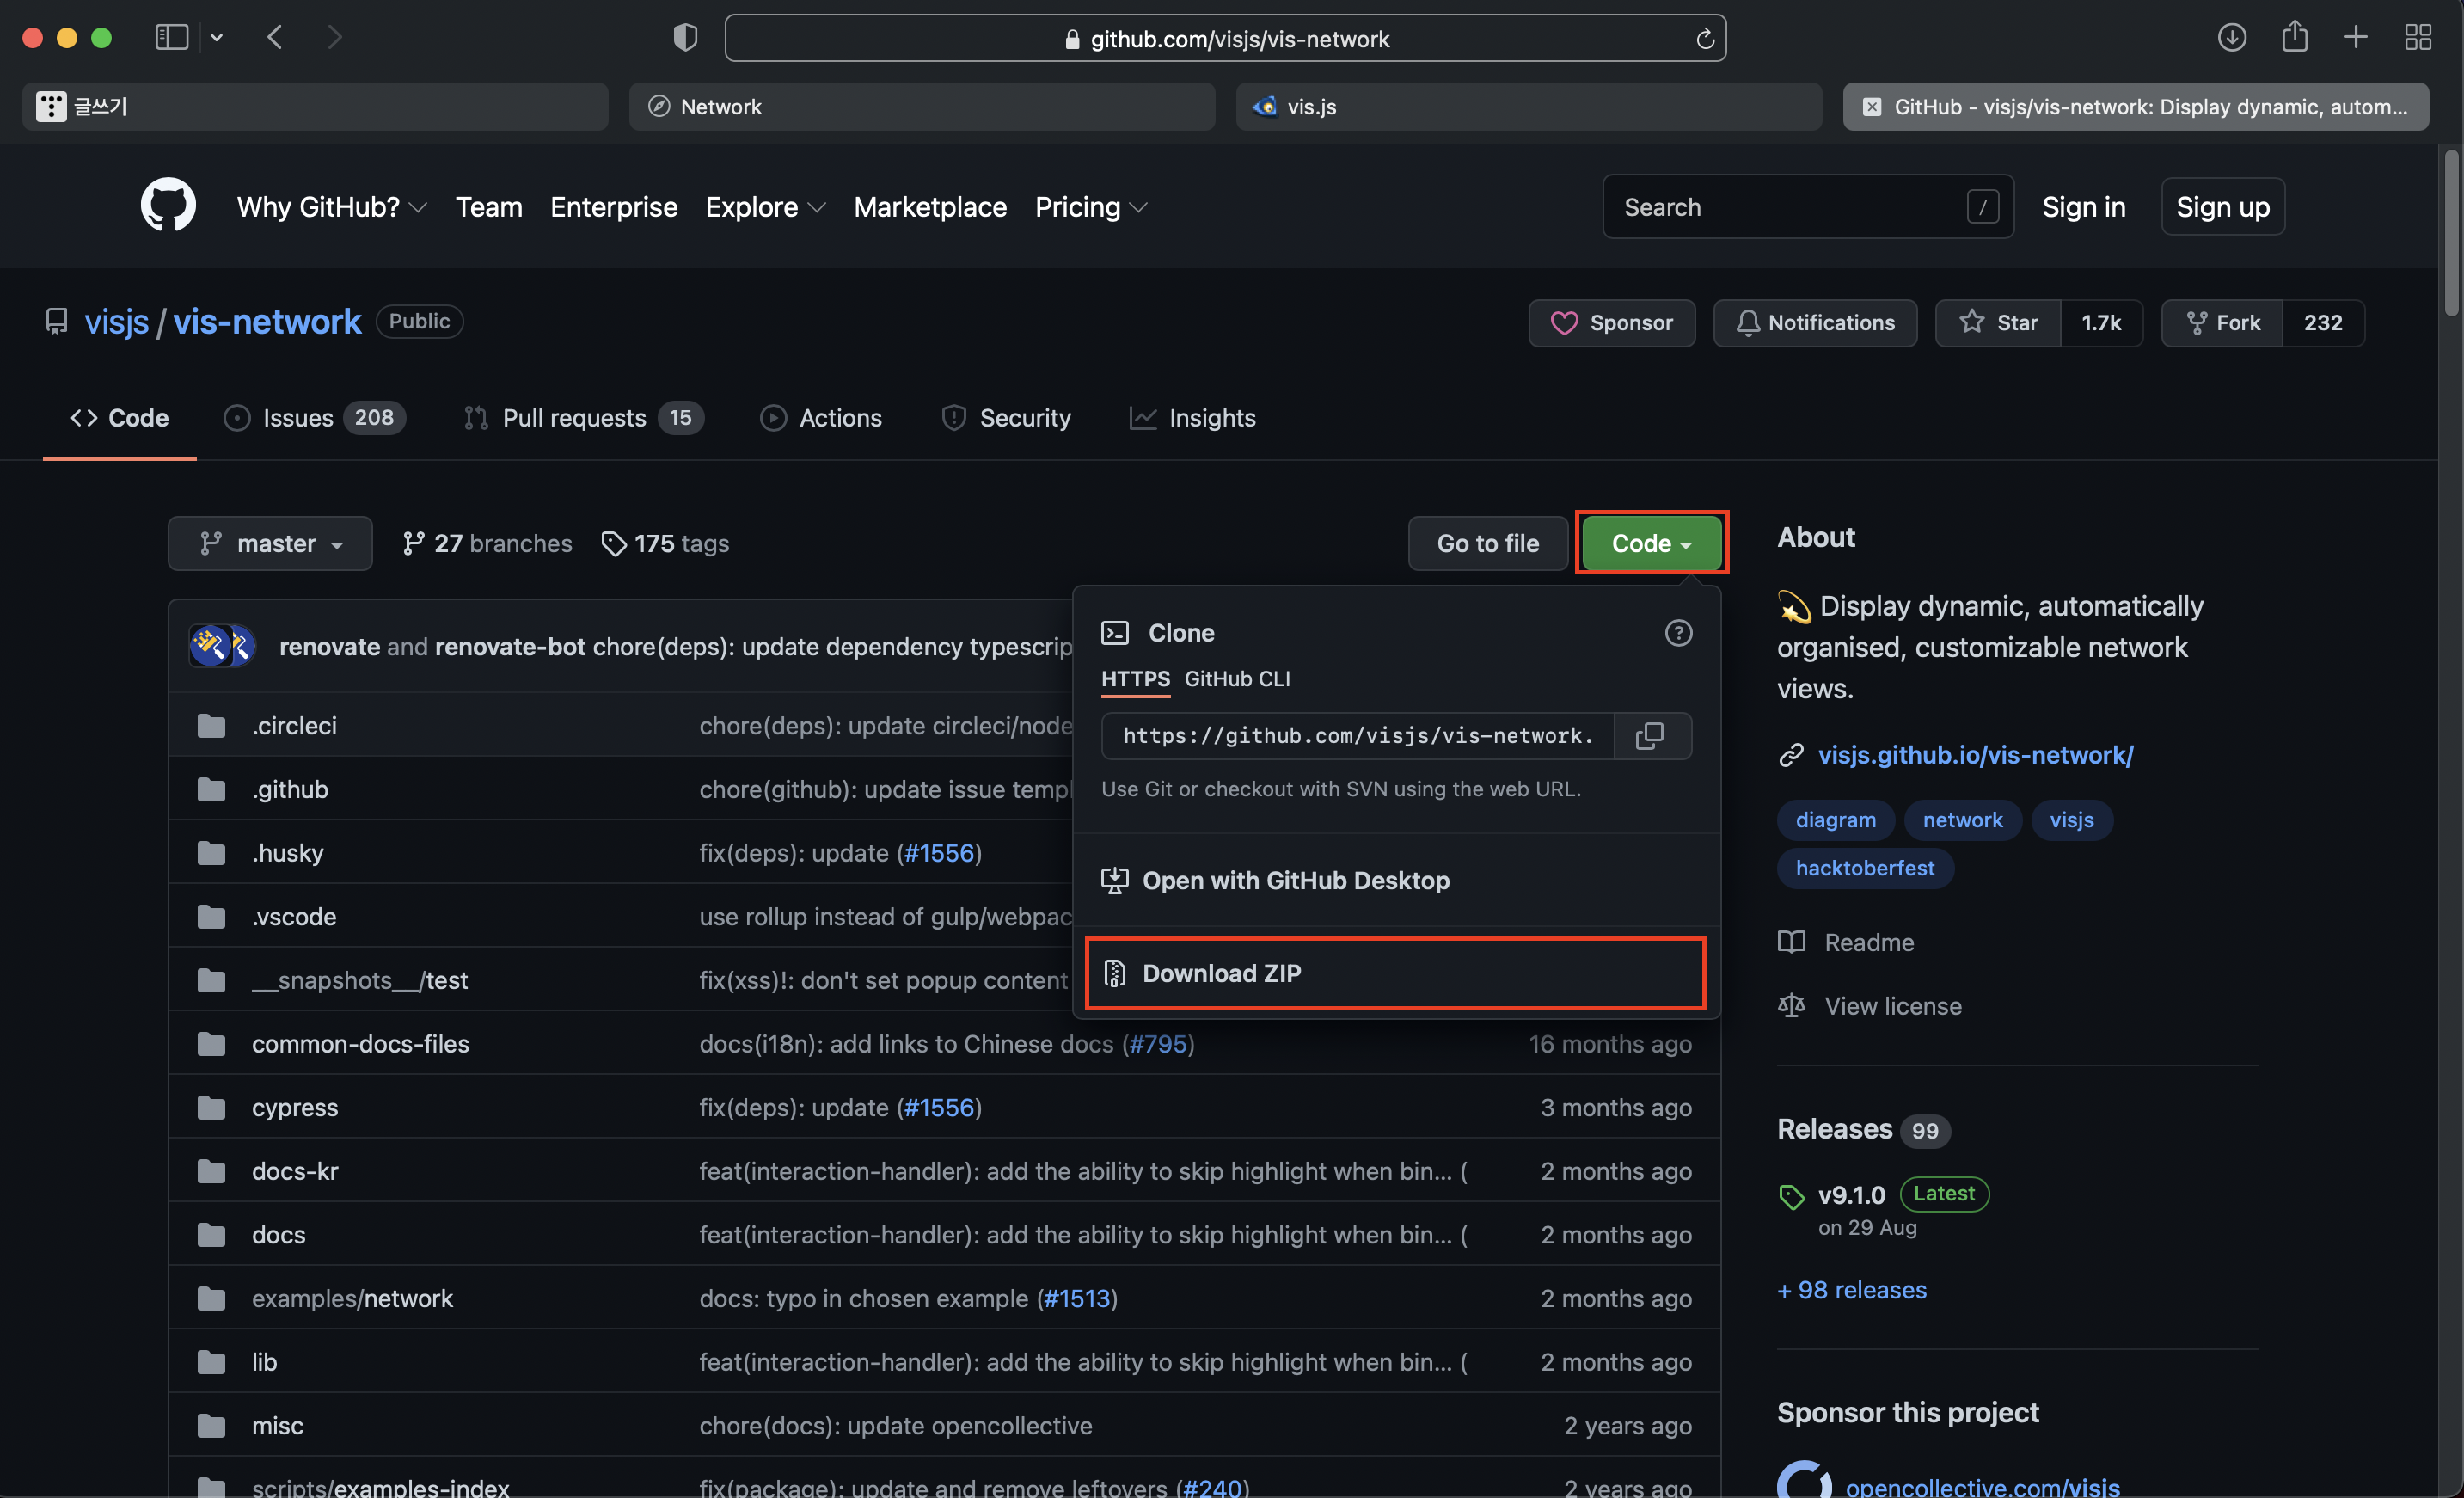
3. 압축을 해제하고 배포 디렉터리인 dist 디렉터리의 js, css 파일을 사용하면 됩니다.
  <script type="text/javascript" src="dist/vis.js"></script>
  <link href="dist/vis-network.min.css" rel="stylesheet" type="text/css" />
2. vis.js 네트워크 토폴로지 예시
토폴로지(topology): 컴퓨터 네트워크의 요소들(링크, 노드 등)을 물리적으로 연결해 놓은 것, 또는 그 연결 방식
2.1. 전체 소스
<!doctype html>
<html>
  <head>
    <title>Network</title>

    <style type="text/css">
      #topology {
        height: 1000px;
        border: 1px solid gray;
        background-color:#333333;
      }
    </style>

    <!-- vis.js lib -->
    <script type="text/javascript" src="../../../dist/vis.js"></script>
    <link href="../../../dist/vis-network.min.css" rel="stylesheet" type="text/css" />

    <script type="text/javascript">

      var nodes = null;
      var edges = null;
      var network = null;

      //vis.js 데이터셋 생성
      nodes = new vis.DataSet();
      edges = new vis.DataSet();

      function draw() {

        //노드 추가
        nodes.add({id: "collector", x:0, y:0, label:"collector"});
        nodes.add({id: 1,  x:-81, y:58, label:'192.168.0.1'});
        nodes.add({id: 2,  x:30, y:-96, label:'192.168.0.2'});
        nodes.add({id: 3,  x:30, y:95, label:'192.168.0.3'});
        nodes.add({id: 4,  x:-81, y:-59, label:'192.168.0.4'});

        //노드 간 링크 추가
        edges.add({from: 'collector', to: 1});
        edges.add({from: 'collector', to: 2});
        edges.add({from: 'collector', to: 3});
        edges.add({from: 'collector', to: 4});

        //토폴로지를 출력할 html element id 지정
        var container = document.getElementById('topology');

        //노드, 링크
        var data = {
          nodes: nodes,
          edges: edges
        };

        //옵션
        var options = {
          nodes: {
            shape: 'dot',
            borderWidth:4,
            size:30,
            color: {
              border: 'white',
              background: '#666666'
            },
            font:{color:'#eeeeee'}
          },
          edges: {
            color: 'lightgray'
          }
        };

        //토폴로지 생성
        network = new vis.Network(container, data, options);

        //토폴로지 이벤트 추가
        network.on("click", function (params) {
          console.log(params.nodes[0]);
        });

      }

    </script>
  </head>

  <body onload="draw()">
    <div id="topology"></div>
  </body>

</html>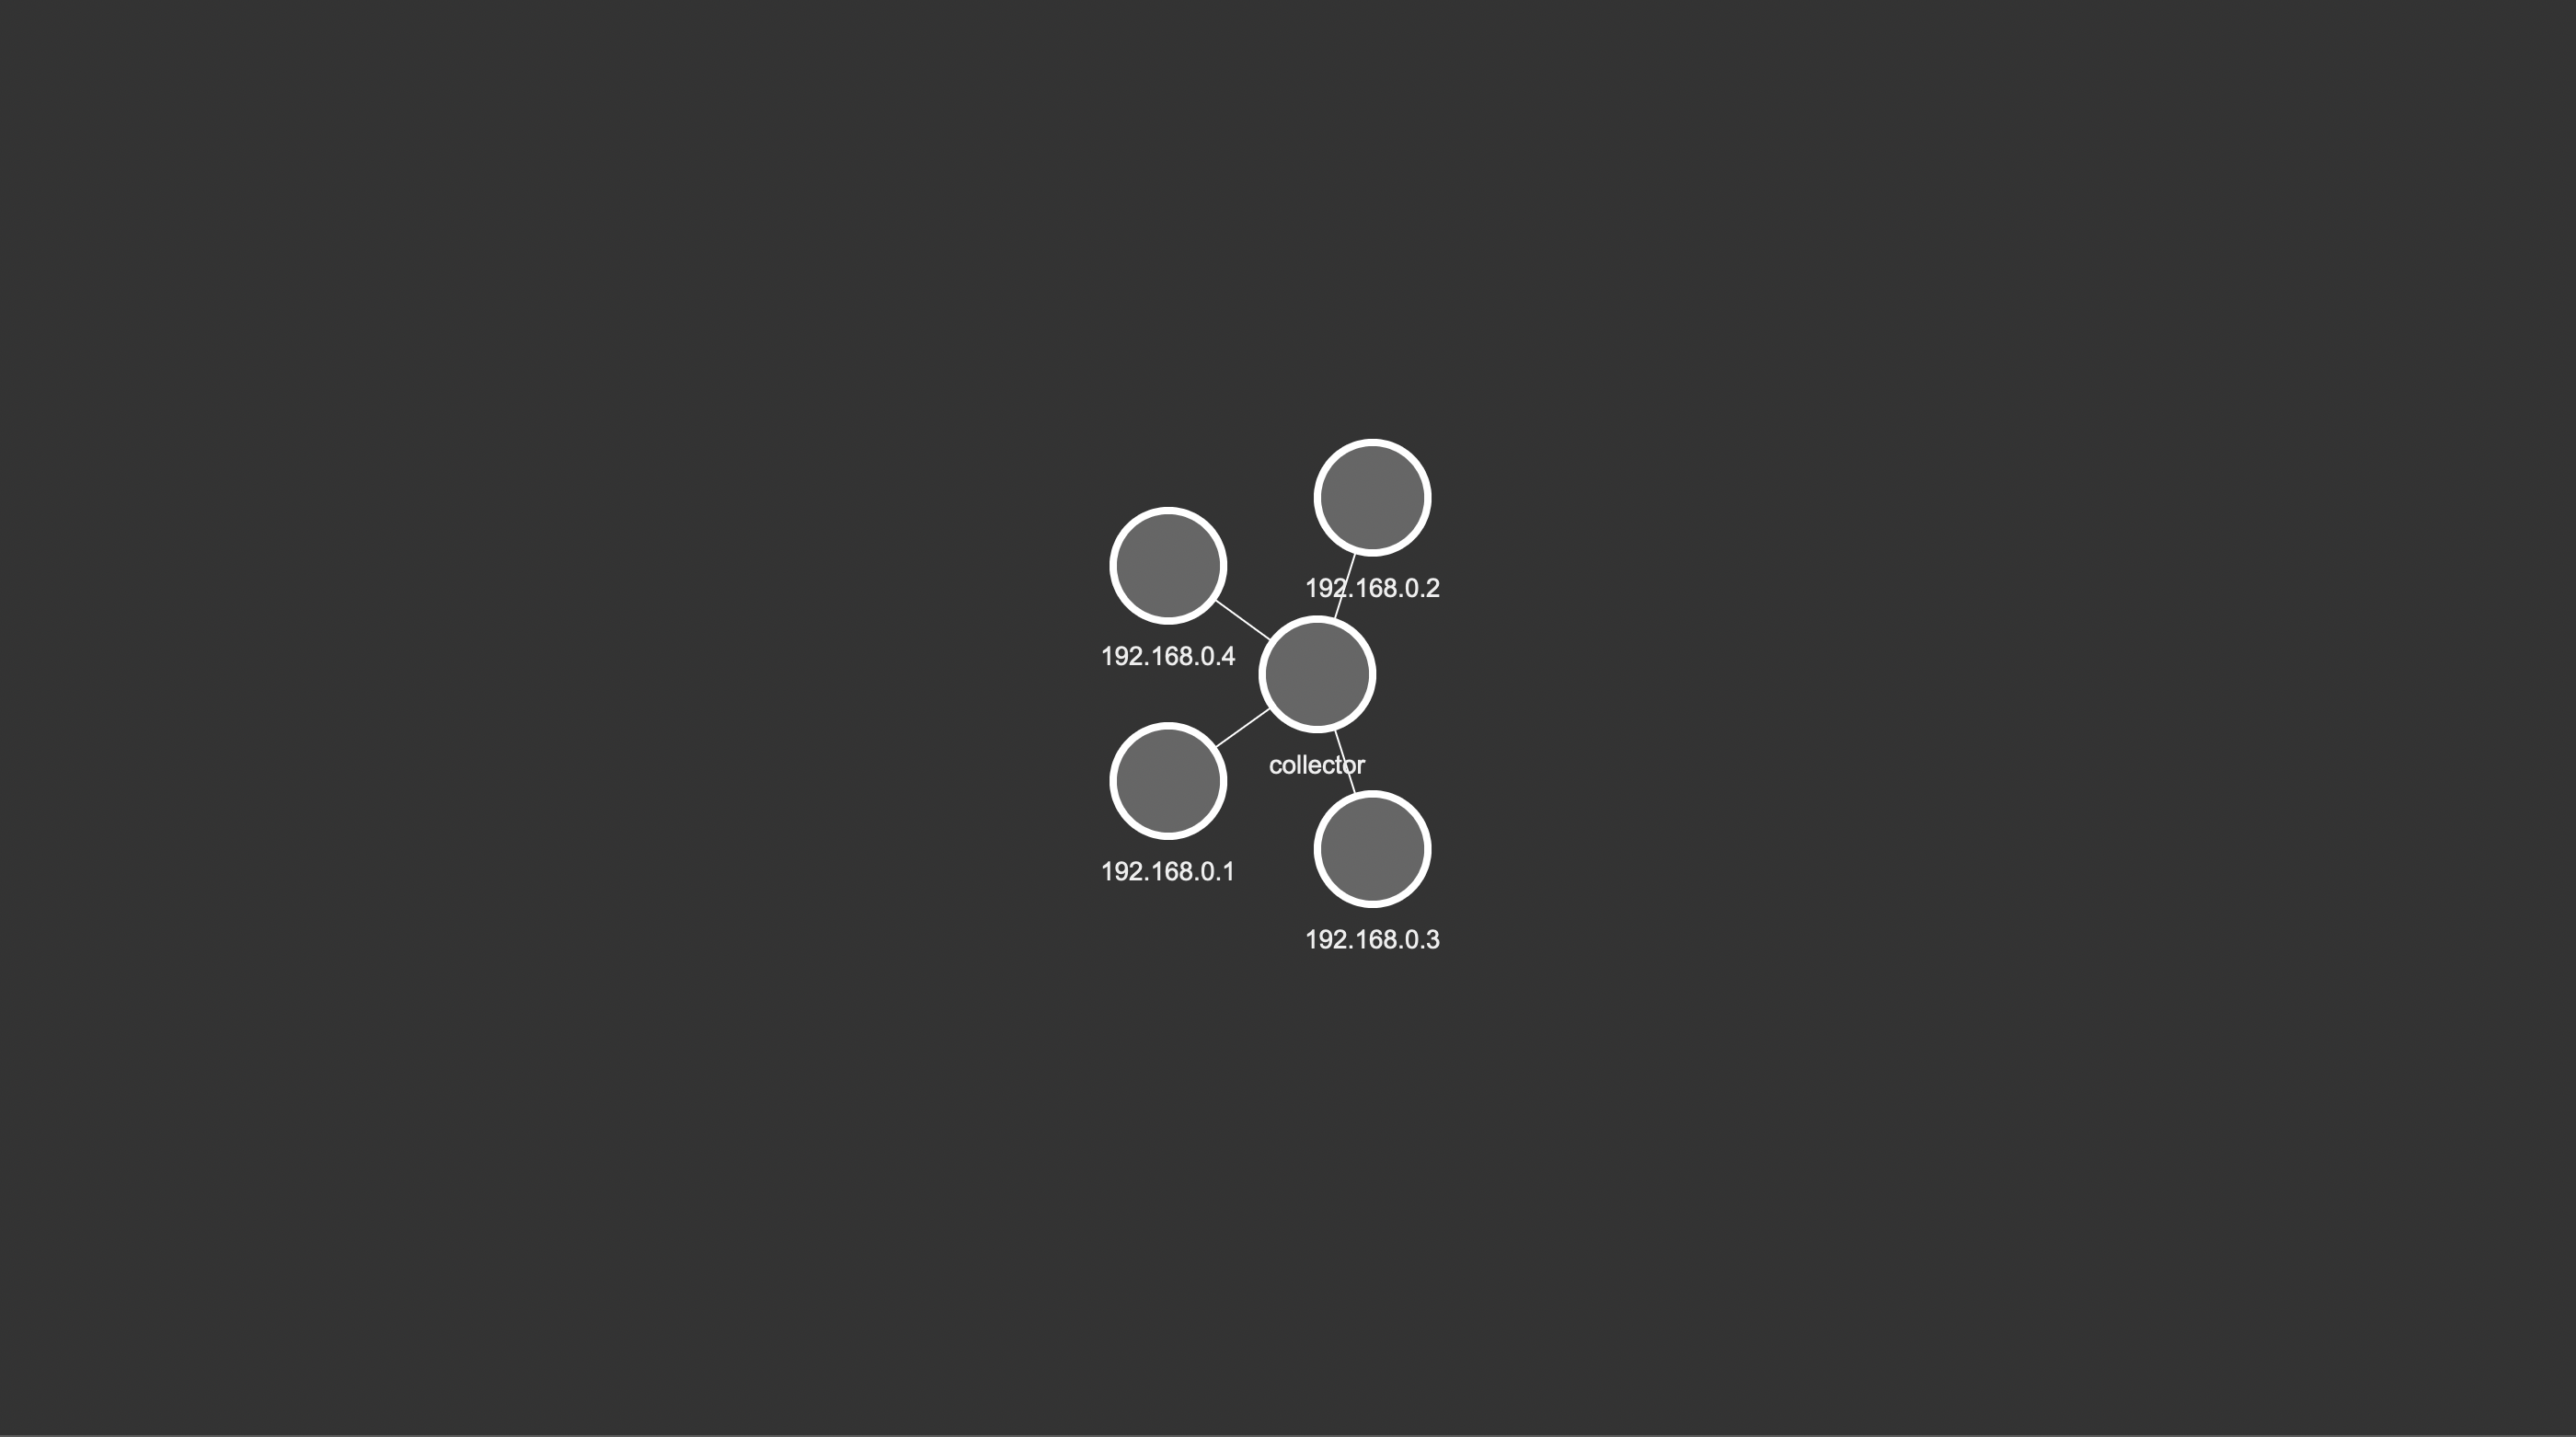
2.2. 노드 조작
- 토폴로지 캔버스가 그려진 이후에도 노드를 추가, 삭제, 업데이트할 수 있습니다.
- 조작 시 노드는 지정한 id로 구분합니다.
//노드 추가
nodes.add({id: 5,  x:81, y:-20, label:'192.168.0.5'});
edges.add({from: 'collector', to: 5});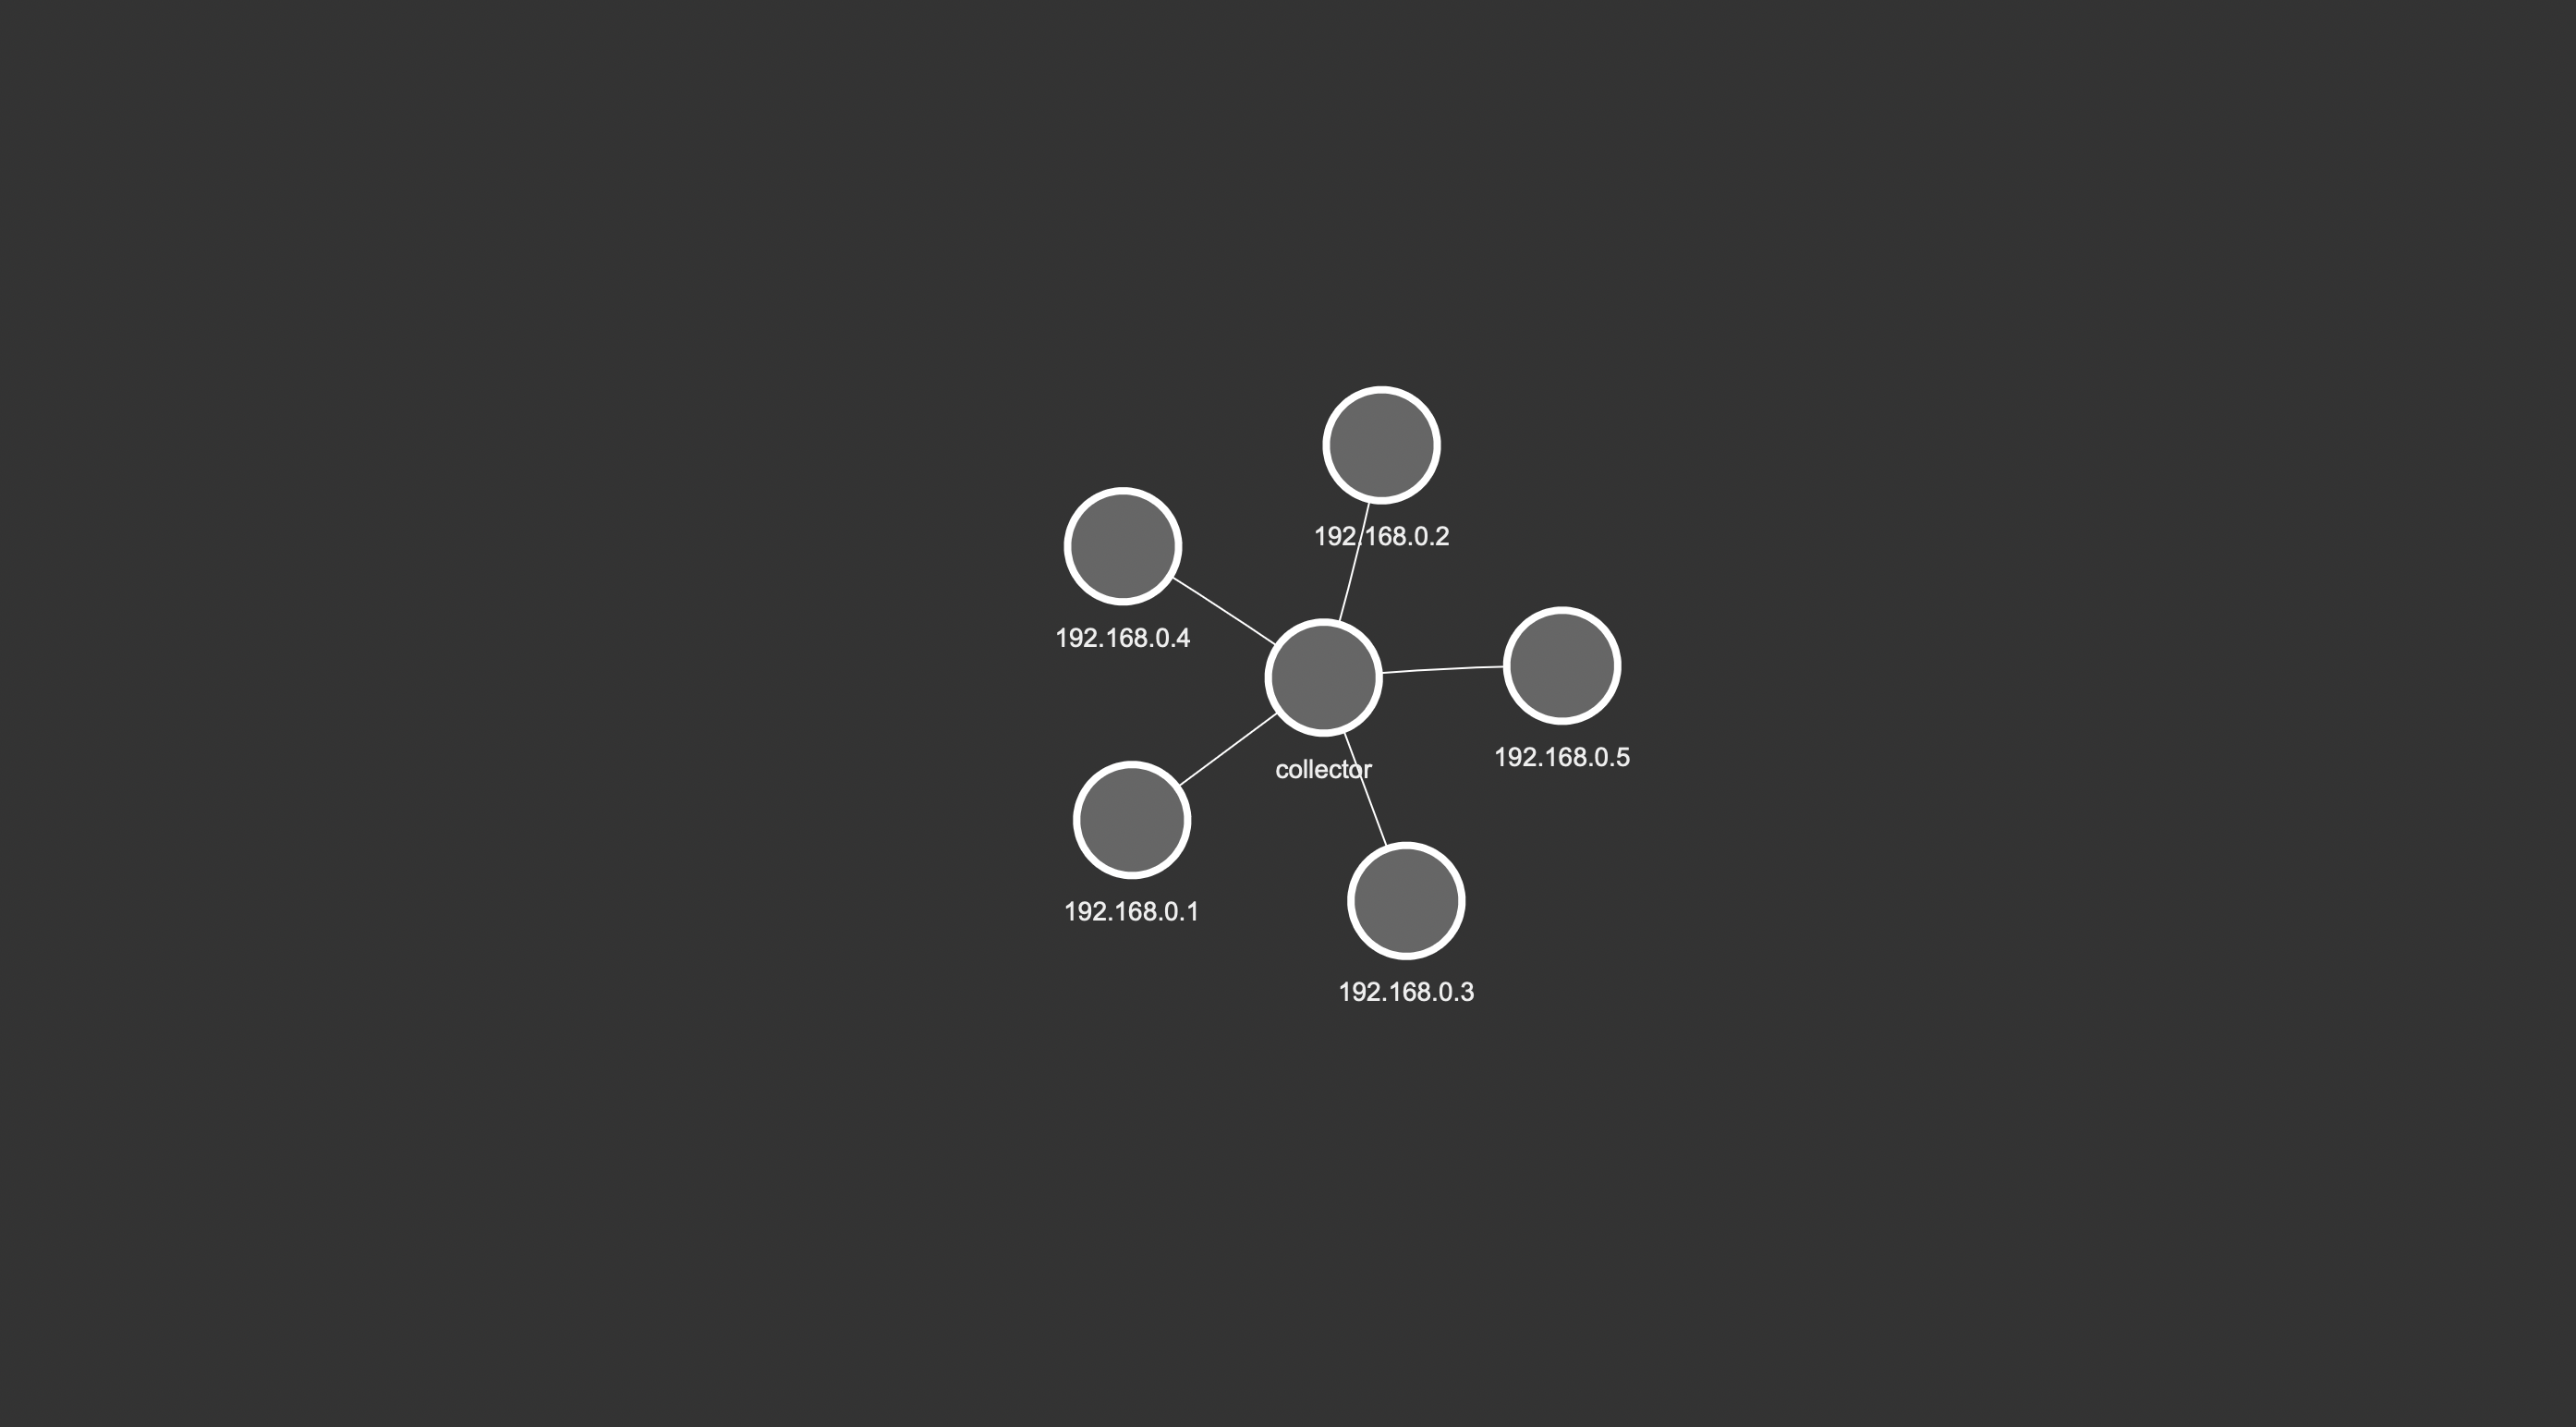
//노드 업데이트
nodes.update({id: 5, color: 'red'});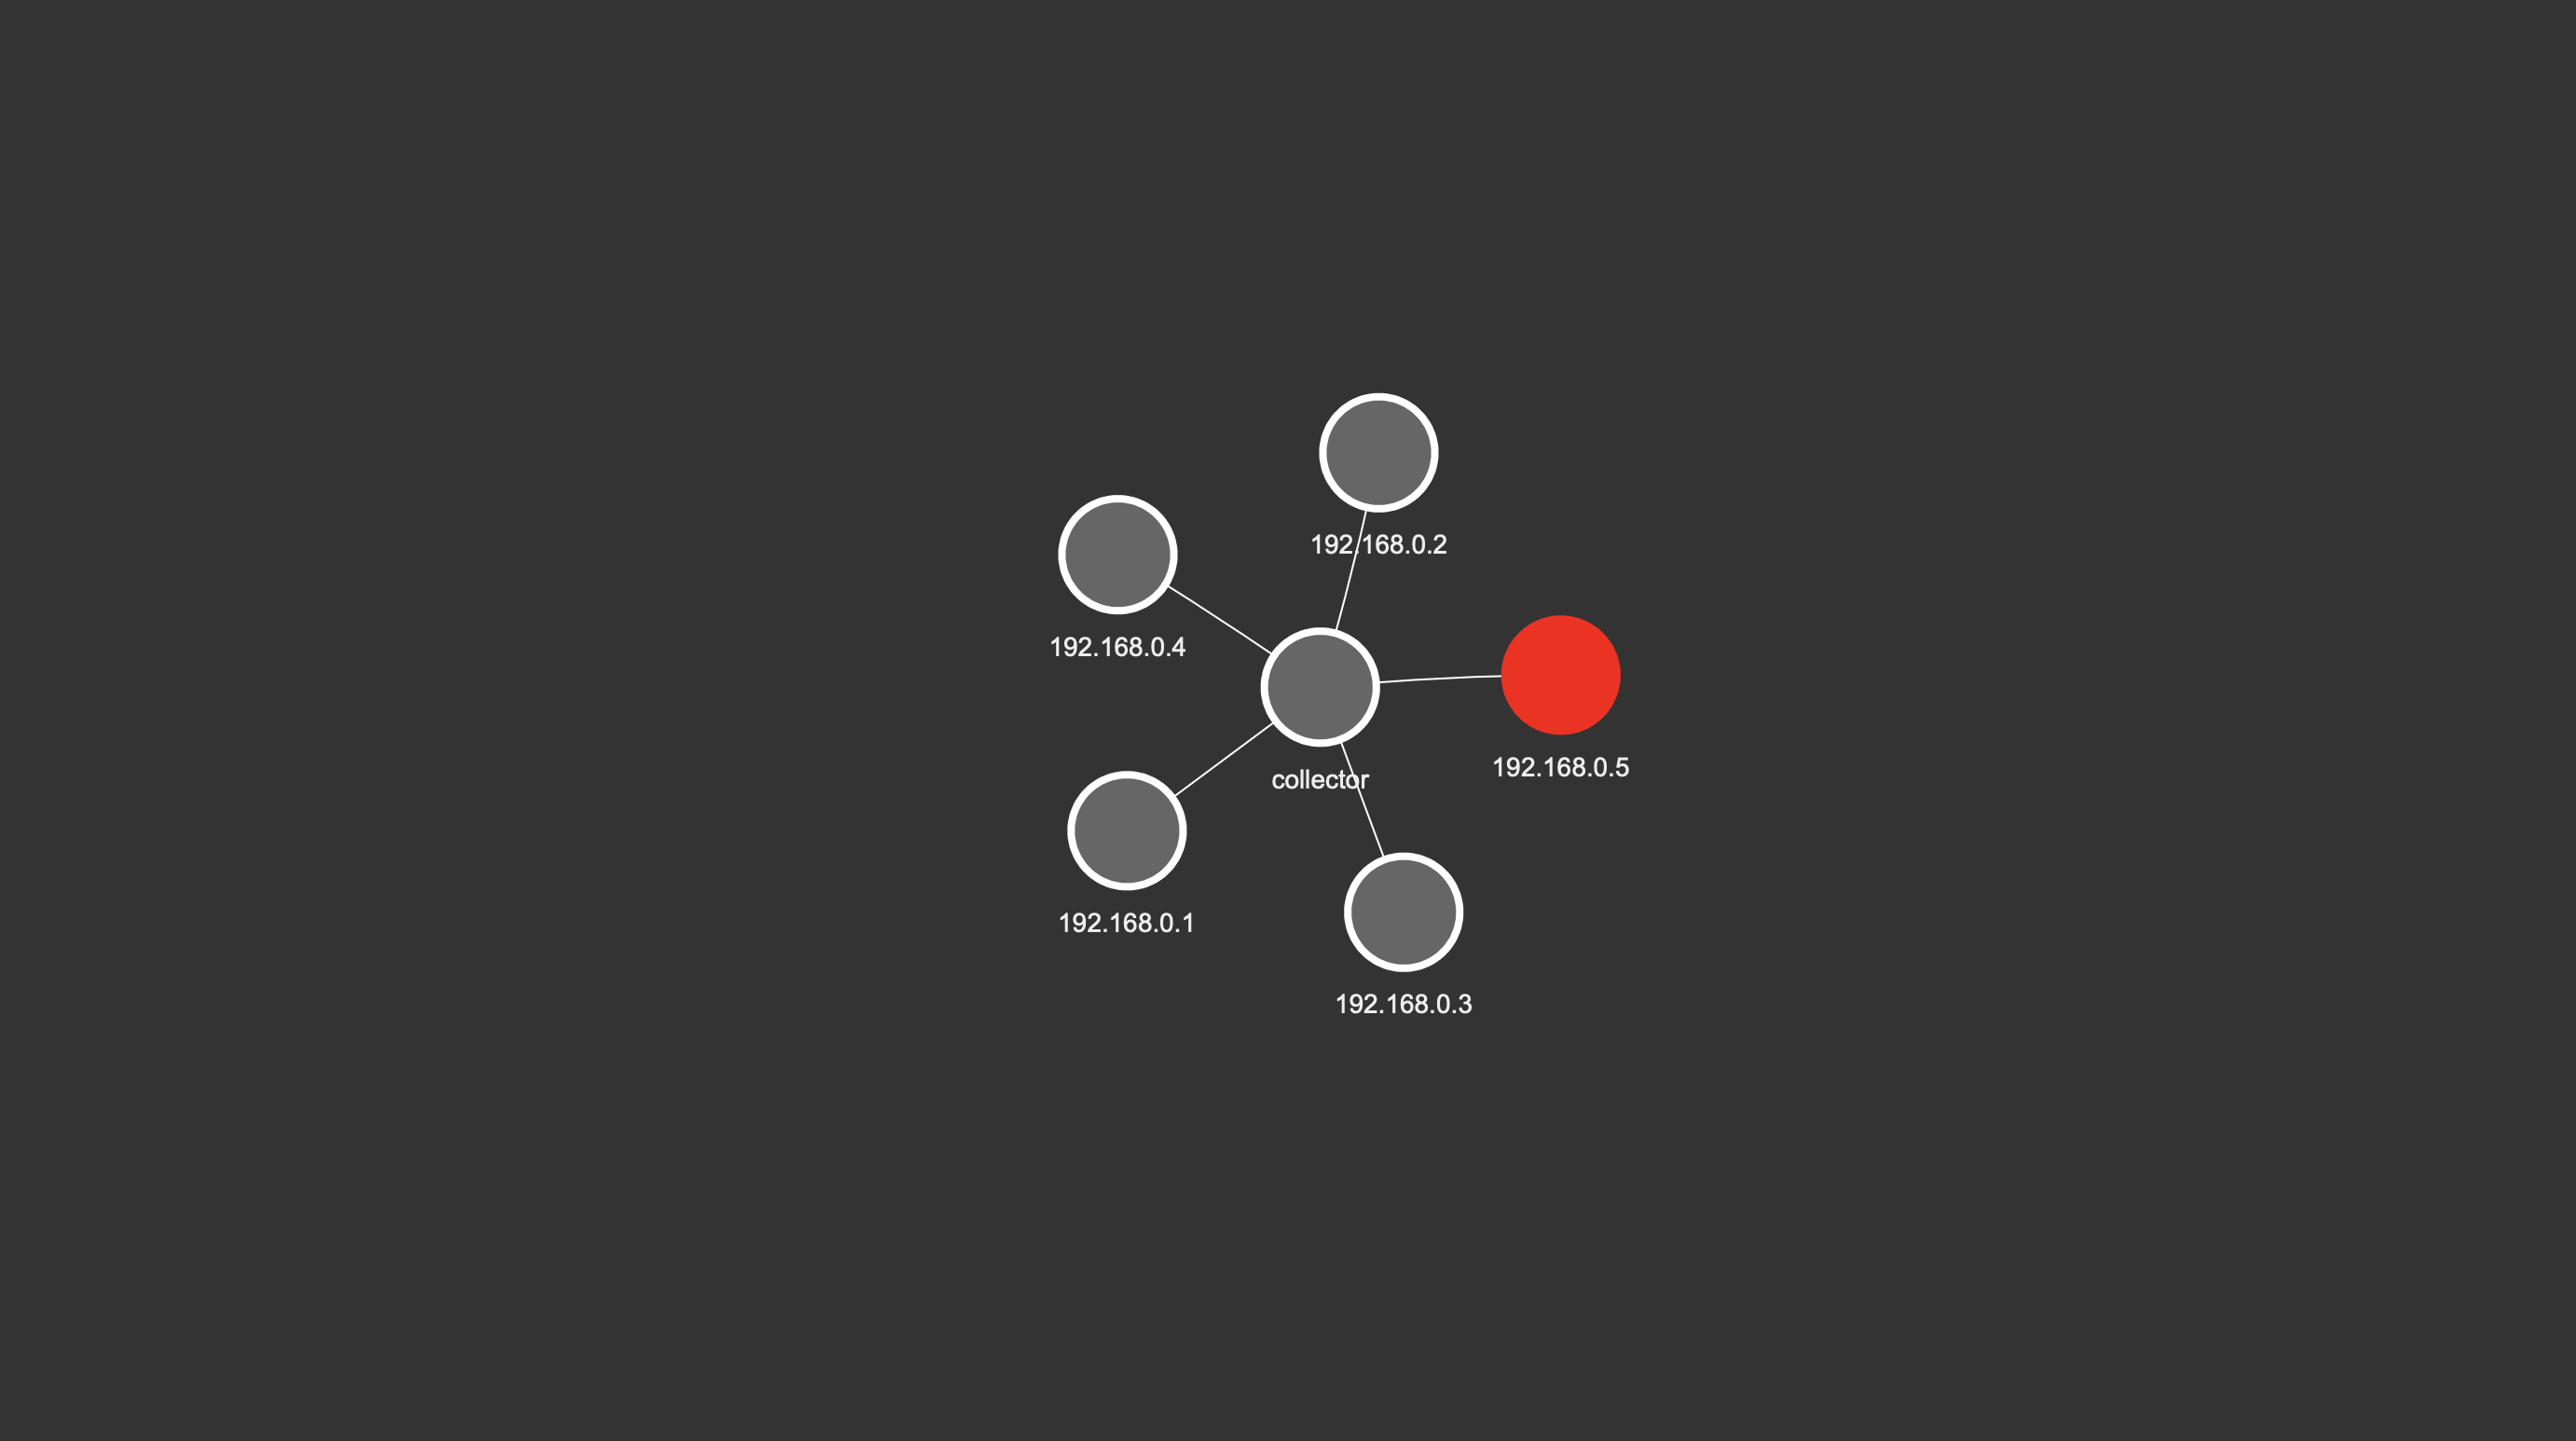
//노드 삭제, 링크 삭제
nodes.remove(5);
edges.remove(5);
2.3. 노드 이벤트
- click, doubleClick, oncontext, hold, select, deselectNode, dragStart 등 다양한 이벤트가 있습니다.
- https://visjs.github.io/vis-network/docs-kr/network/#Events
vis.js - Network documentation.
반환값: Array Node는 클러스터에있을 수 있습니다. 클러스터는 클러스터에있을 수도 있습니다. 이 함수는 Node의 위치를 보여주는 nodeId 배열을 반환합니다. 체인의 nodeId, 특히 첫 번째 매개 변수로
visjs.github.io
network.on("click", function (params) {
	if(params.nodes[0] != undefined){
		alert(params.nodes[0] + " id node");
	}
});
'Frontend > Javascript' 카테고리의 다른 글
| [typeScript] 타입스크립트 개발 환경 설치하기 (0) | 2022.06.01 |
|---|---|
| [axios.js] GET, POST 방식으로 서버와 통신하기 (0) | 2021.10.21 |
